Problem
The problem that is addressed in this dissertation project is an inherent problem within a lot of marketing teams that are utilizing social media, they have little to no functionality to maintain and visualize data for social media campaigns. Largely due to the fact that these companies have to use multiple products to enable them to get all the functionality they need, as a result of this licensing cost is high. In a cost-effective model data visualization and analysis is put in the background as many small companies can’t afford to pay thousands of pounds a month for multiple products.
“Every manager’s goal should be to move away from fuzzy measurement and towards quantifiable metrics. That way, a manager can understand what’s working and what’s not — and revise the approach accordingly.”
Architecture
React-Redux was the best technology for the front end of the application, the compatibility with Firestore and the ability to build a native application with ease and the big advantages which influenced the decision. From the market research having the application work on mobile environments too was key, lending the chosen framework to be React. React was used alongside Redux, thunk and various other bolt-on technologies. All of these bolt-ons allow for the true functionality required on the data binding side of the front end of the application.
NodeJs was used to develop the backend of the website, this was in the form of an API in which the front-end communicates with. NodeJS was selected as the best technology to use alongside the front-end due to its ease of use with the Twitter API and its general data analysis/streaming functionality especially when it needs to be integrated with a web application. The speed on which NodeJs can do sentiment analysis on tweets is also very important, as is defined by market research. The speed of sentiment analysis can dictate the position of the currently tracked campaign and needs to be as real-time as possible with premium access to the Twitter development API.
Process
The beginning of the process of the project was design, this design stage started with the selecting of a library to use to build the application with reactJS. As the design standards that were to be adhered to was Google’s material standards, the library that was used was the reactJS material library.

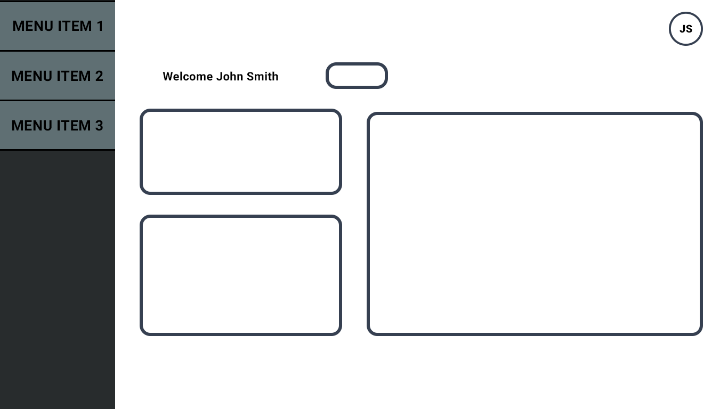
The development process started with the back-end development following a test-driven development process. Unit tests were developed according to the previously defined acceptance criteria. The dashboard is served up as a view consisting of multiple components, as per the wireframes this view will contain multiple charts to visualize the data, a live stream of all the tweets and the campaign switch which allows the user to change through the campaigns that user has created. The campaign areas serve as the main area to add campaigns and look through any comparing the user may have created. As per the wireframes, this was to be a simple view which could be divided into two main components: a component to add campaigns and a component which displays all the user's campaigns in a table.


Visit the dissertation source code.